
Study Guide: Data Visualization
All about how to read visual data.
What is Data Visualization?
Data visualization is a fancy name for turning raw information into meaningful pictures. is the graphical (pictoral) representation of information. By using visual elements such as charts, graphs, maps, and animation, data visualization tools provide an accessible way to see and understand trends, outliers, and patterns in data.
Vocabulary
- Data: The raw information, usually in numbers and often tabulated into rows and columns
- graphical representation: Pictures illustrating underlying data
- Visual Element: Parts of the picture that add meaning
- Chart: Data sorted into columns and rows
- Graph or Graphic: Latin for Picture
- Map: A visual model, for example of the Earth showing land and sea, roads and cities, mountains and forests, national boundaries, etc.
- Trend: A pattern in the data that helps us predict the future
- Pattern: A regular or repeating design that gives meaning
- Outlier: Specific values in data that do not seem to fit the pattern
Types of charts and graphs
Table
Line Chart
Bar Chart
Stacked Bar Chart]
Pie Chart
Scatter Plot
3D Graph
Histogram
Spider Chart
Flow Chart
Gantt Chart
Hierarchy Diagram
Timeline
Tree Diagram
Radial Tree
Sunburst Chart
Venn Diagram
Heat Map
Solar Terminator (Night and Day)
Pictogram
Animation
Word Cloud (Interactive)
Epicyclic Gearing (Interactive)
From Wikipedia: “one or more outer gears, or planet gears, revolving about a central, or sun gear… Epicyclic gearing systems also incorporate the use of an outer ring gear or annulus, which meshes with the planet gears.”
Map
3D Map of the Earth
Shoreline Map (A different way to see the Earth)
Obama’s Face
US in Watercolor
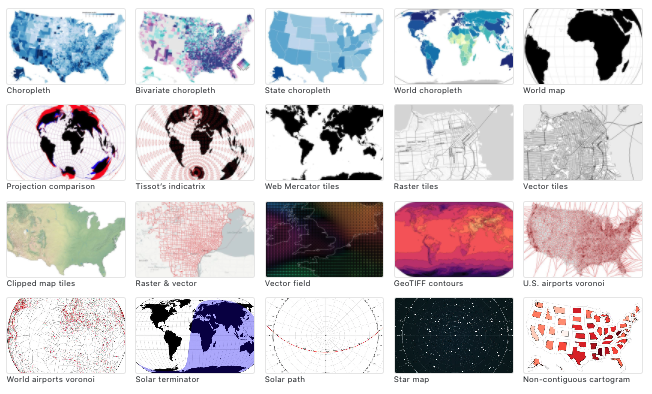
Many Examples
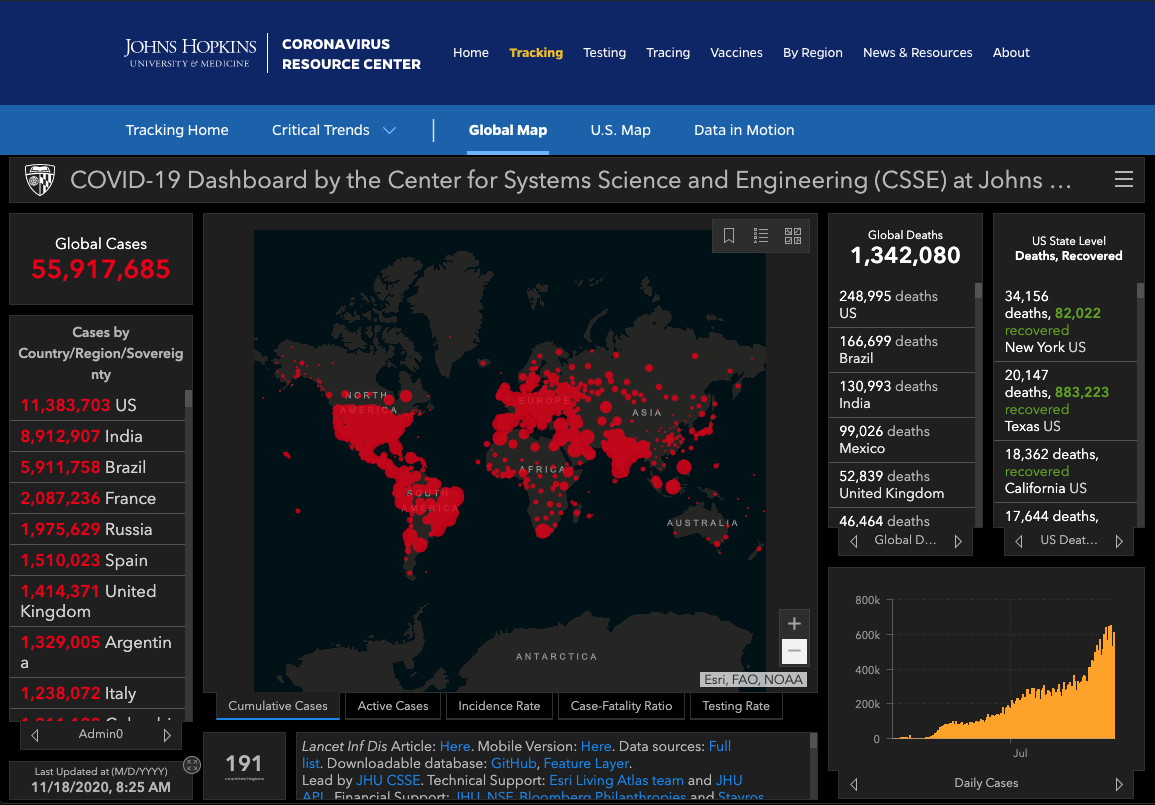
John Hopkins Coronavirus
Coronavirus Global Map
Coronavirus US MAP
Coronavirus New Cases
Coronavirus Critical Trends, California
NASA Climate
Greenhouse Gas Effect
Global Temperature
Global Temperature Data
Climate Time Machine
Global Salinity Video
[ Global Methane Sources]()
Large methane emissions from oil and gas operations detected by satellite in 2020
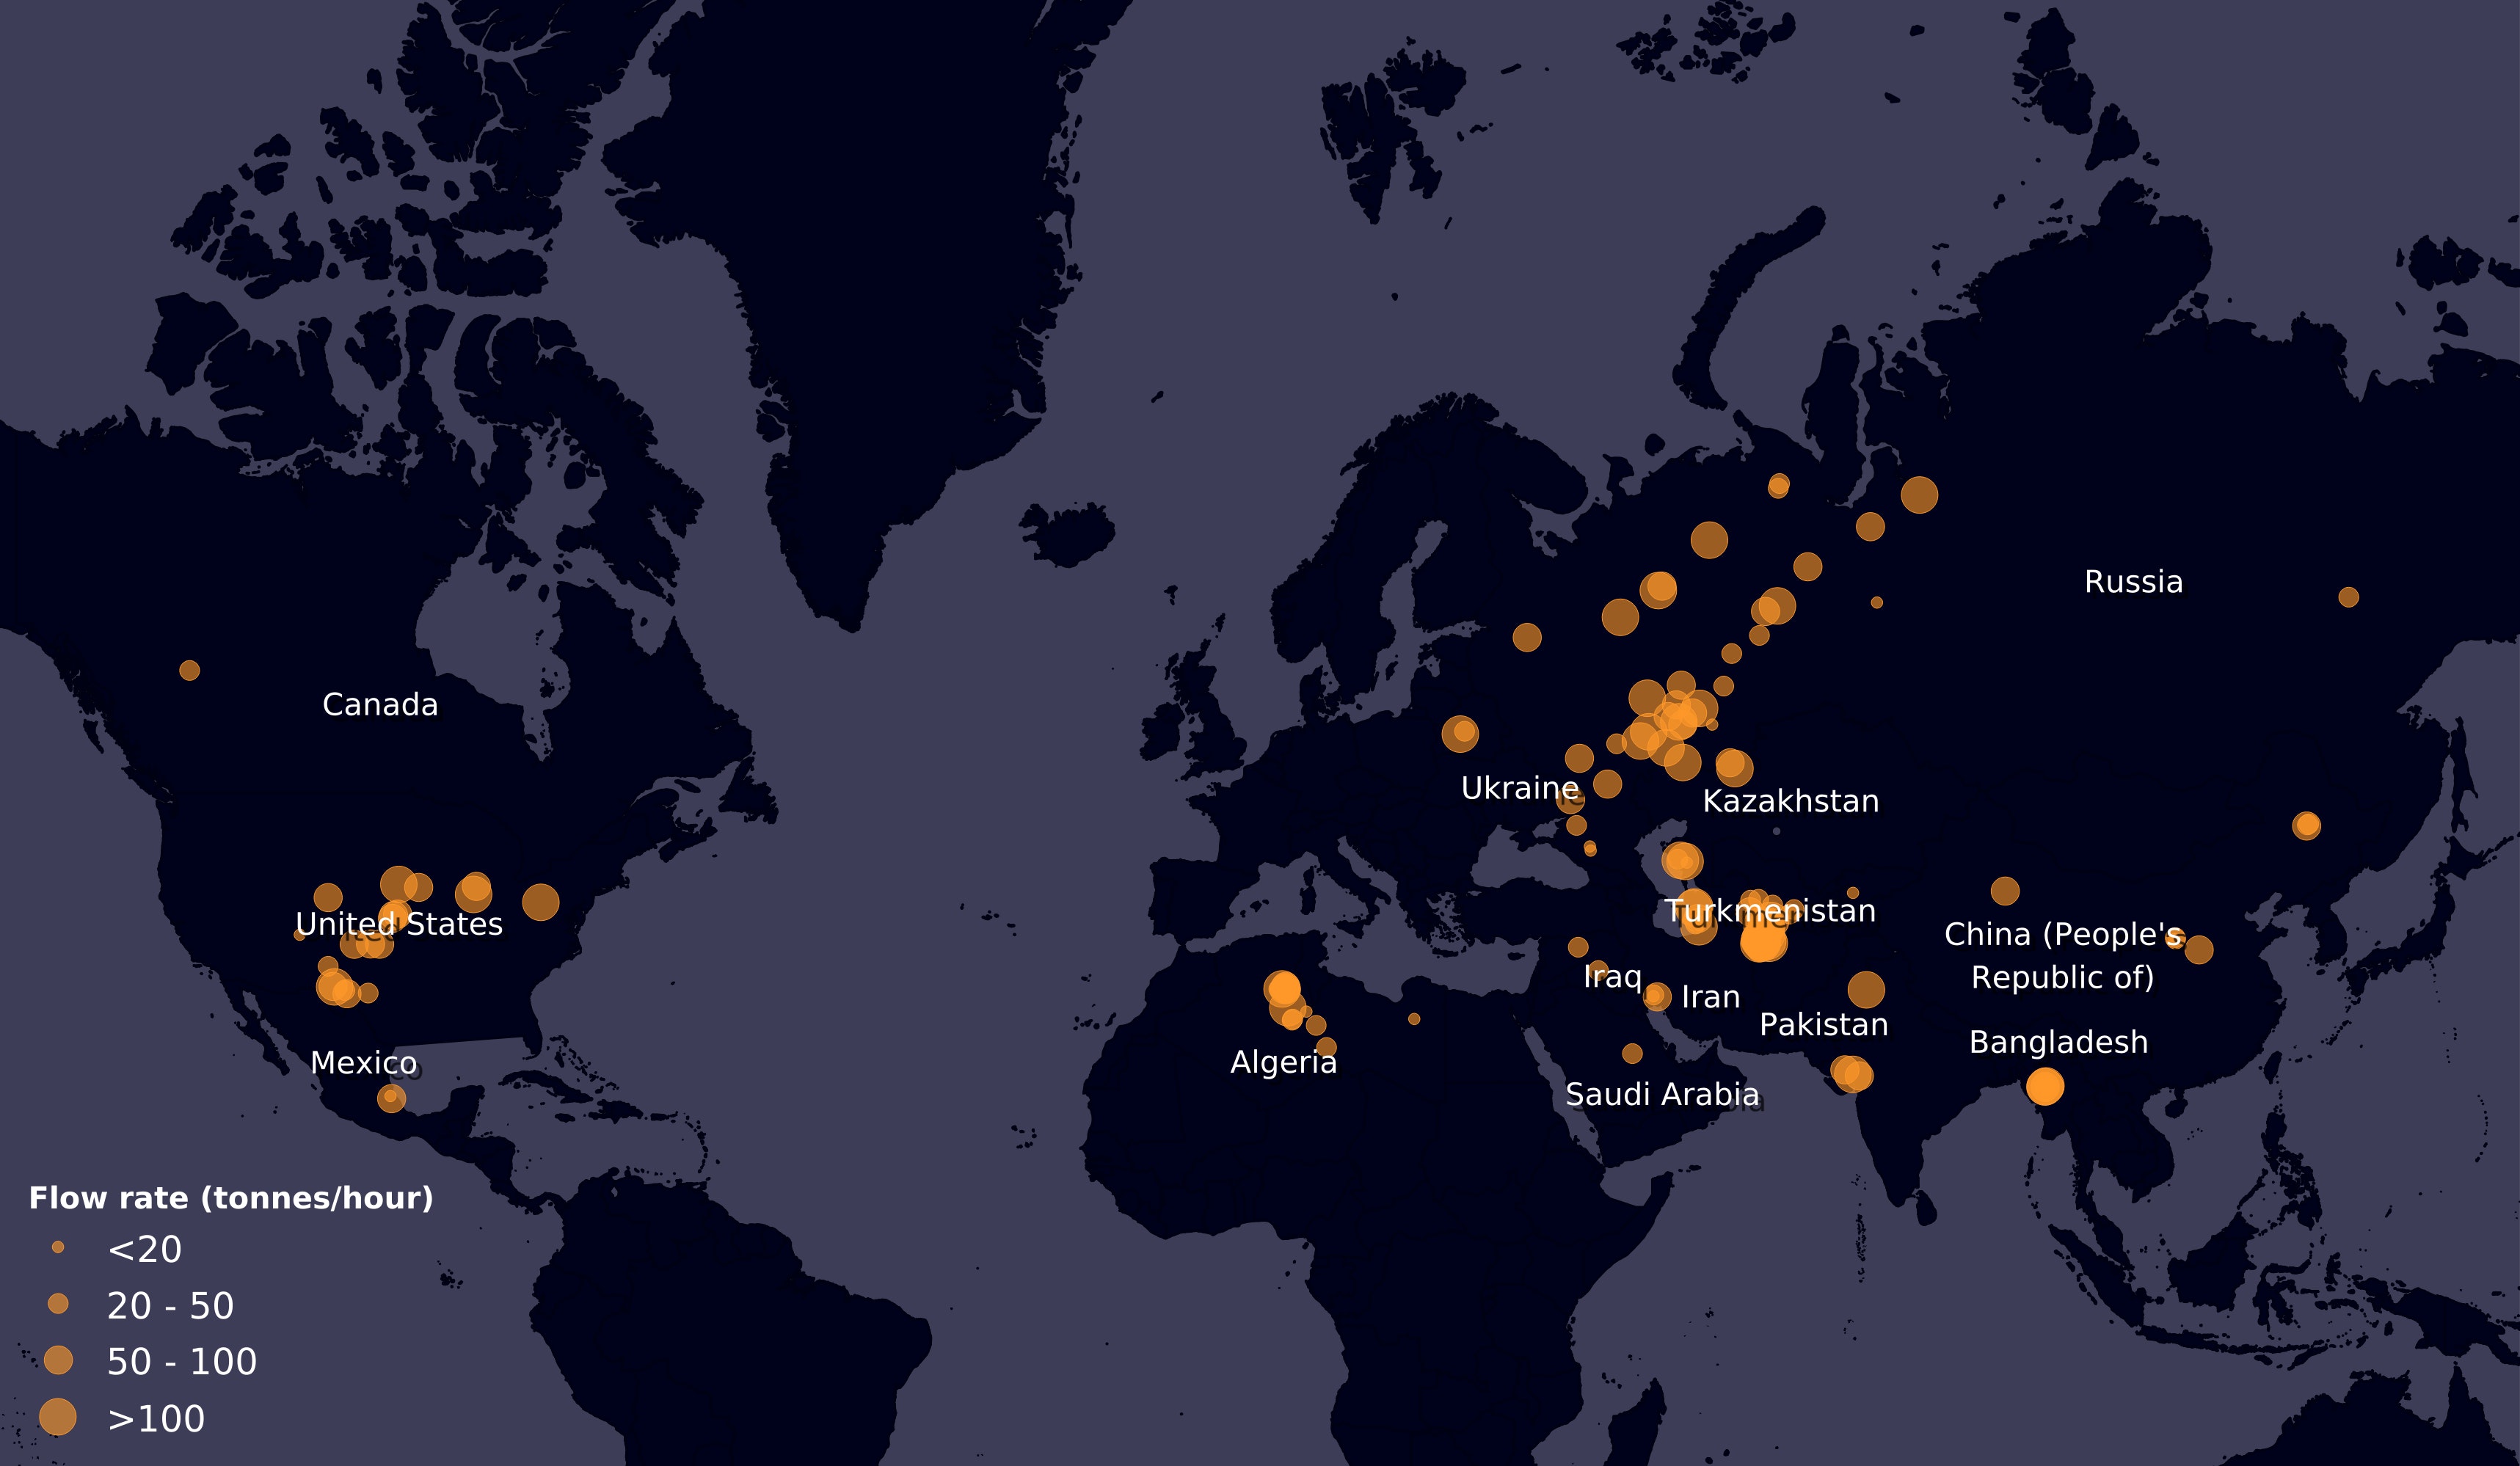
https://www.iea.org/reports/world-energy-outlook-2020
Solutions
Source: https://class.ronliskey.com/study/mathematics-8/data_visualization/