
Study Guide: Functions
Relations relate a set of input values to matching output values in any combination.
Functions are relation, but not all relations are functions. Functions relate each input value to one specific output value.In other workds, for each input value there can be only one matching output value. Yet another way to say this is, “a function can not be a one-to-many relation”.
Many functions can be defined using equations, but NOT ALL!
Terminology
- Functions
- Relations
- Sequences
- Domain
- Range
- x-axis
- y-axis
- Ordered Pair
- One-to-one (1-to-1)
- One-to-many (1-to-∞)
- Many-to-one (∞-to-1)
- Solving for a variable
- Coordinate Grid (Cartesian Coordinate Grid)
- Scatter Charts
- Correlation (Postive, Negative, or None)
- Standard Form
- Slope
- Slope-Intercept Form
- Distance Formula
- y-intercept
- Rise over run
- Delta x ($Δx$) and Delta y ($Δy$)
Because functions are so important in math, science, medicine, engineering, etc, many different terms are used. The main thing to keep straight is which term refers to the input and which to the output.
| Input | Output | |
|---|---|---|
| x | y | |
| Domain | Range | |
| Independent variable | Dependent variable |
Functional Notation
As first used by Leonhard Euler in 1734, functions are often shown using a single lowercase letter, such as \(f\), \(g\), and \(h\). The following function is read as, “$y$ equals $f$ of $x$”.
This means that the pair ($x$, $y$) belongs to the set of ordered pairs defining the function $f$.
$x$ is the domain of the function identified as $f$.
$y$ is the range of the function identified as $f$.
\[ y=f(x) \]
Limitation on Functions
An important limitation of a function is that for every x-value there can be only one y-value. This limitation allows us to use functions when we need specific answers to important questions.
Example: We can graph the high temperature for each day. (The high temperatures do NOT need to be different. Monday and Tuesday might both have a high of 75° F, but because there is one—and only one—high temperature for each day, this would still be a function.
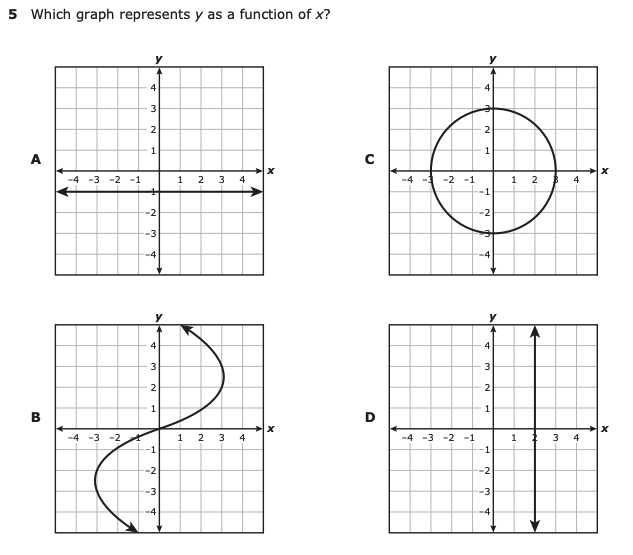
Vertical Line Test
The vertical line test makes it easy to see if a graph is a function.
Method
- Draw horizontal lines through the graph.
- If you can find any place where a horizontal line touches two or more y-values then the graph is not a function.
Ordered Pairs
An ordered pair is a set of two values that are related to each other in some way. For example, we could create ordered pairs relating the age and height of the following people:
| Person | Age (yrs) | Height (ft) | Ordered Pair (x, y) |
|---|---|---|---|
| Joe | 11 | 5 | (11, 5) |
| Bill | 11.5 | 5.3 | (11.5, 5.3) |
| Sally | 12 | 5.4 | (12, 5.4) |
| Lin | 12.3 | 5.7 | (12.3, 5.7) |
| Raymond | 13 | 6.8 | (13, 6.8) |
| Jose | 13.5 | 5.9 | (13.5, 5.9) |
| Petunia | 14.3 | 5.7 | (14.3, 5.7) |
| Carlos | 14.9 | 6 | (14.9, 6) |
| Judy | 15.6 | 6.2 | (15.6, 6.2) |
Scatter Charts
Scatter charts can be used to display (or graph) order pairs. Graphs allows us to more easily see relationships and trends in the data.
Correlations and Predictions
A correlation describes a relationship between two sets of data. There are three types of correlation, postive correlation, negative correlation, and no correlation.
We can often make predictions based on postive and negative correlations, but it is not possible to make predictions when there is no correlation in the data. Think of no correlation as random information that has no apparent pattern.
Positive Correlation
Both sets of data values increase. The above chart shows a positive correlation for age and height.
Negative Correlation
One set of data values increases while the other decreases.
No Correlation
There is no correlation between the data sets.