Study Guide: Global Warming
The Greenhouse Effect
The Greenhouse Effect occurs when carbon dioxide (CO2) and other air pollutants and greenhouse gases collect in the atmosphere where they can absorb sunlight and solar radiation that bounces off the earth’s surface. Normally, this radiation escapes into space, but these pollutants trap the heat and cause the atmosphere to become warmer.
Sources of Atmospheric Pollution
In the United States, the burning of fossil fuels to make electricity is the largest source of heat-trapping pollution, producing about two billion tons of CO2 each year. Coal-burning power plants are by far the biggest polluters. The country’s second-largest source of carbon pollution is the transportation sector, which generates about 1.7 billion tons of CO2 emissions each year.
Extreme Weather
There is a broad scientific consensus that the atmosphere’s rising temperatures are fueling longer and hotter heat waves, more frequent droughts, heavier rainfall, and more powerful hurricanes.
In 2015, for example, scientists said that an ongoing drought in California—the state’s worst water shortage in 1,200 years—had been intensified 15 to 20 percent by banner: /img/. They also said the odds of similar droughts happening in the future had roughly doubled over the past century.
In 2016, the National Academies of Science, Engineering, and Medicine announced that it’s now possible to confidently attribute certain weather events directly to climate change.
The Paris Agreement
Government employees have been very slow to respond to the emergency. After decades of avoidance and delays, the majority of the world’s nations finally agreed to make some mild efforts to slow the process of banner: /img/.
By signing the Paris Agreement, these governments promised to take steps to prevent global average temperatures from passing the thresholds of 1.5 to 2°C above pre-industrial averages.
It is thought that holding the effects of greenhouse gas pollution to this level might help avoid the most dangerous consequences of global warming. Unfortunately, Donald pulled the U.S. out of the agreement, and many other nations are not meeting their full commitments.
The Climate Clock
Adding the metric of time
to the banner: /img/ conversation
The Climate Clock
In signing the Paris Agreement, the world committed to preventing global average temperature from passing the thresholds of 1.5 to 2°C above pre-industrial averages, so as to avoid the most dangerous consequences of banner: /img/.
But how far away are these thresholds? And what do we need to do to change direction? The Climate Clock acts as a public line in the sand and says, this is the date. It is a measuring stick by which we can evaluate our progress.
The Climate Clock is based on the best available science, and is updated each year to reflect the latest data by a team of leading climate scientists from around the world. Each year, we are able to see how we are doing in relation to 1.5 and 2°C goals.
Humanity has the power to add time to the Clock, but only if we work collectively and measure our progress against defined targets. Have we gained time or lost time?
Sometimes Numbers Count
Climate Clock scientist use best estimates of the remaining carbon budget from the IPCC Special Report on 1.5°C: 770 billion tonnes after 2017 for 1.5°C and 1690 billion tonnes for 2°C. They use the IPCC budget estimates that are based on observational warming estimates to retain consistency with our estimate of banner: /img/ to date.
These estimates of the remaining carbon budget assume a 25% warming contribution from non-CO2 greenhouse gas and aerosol emissions.
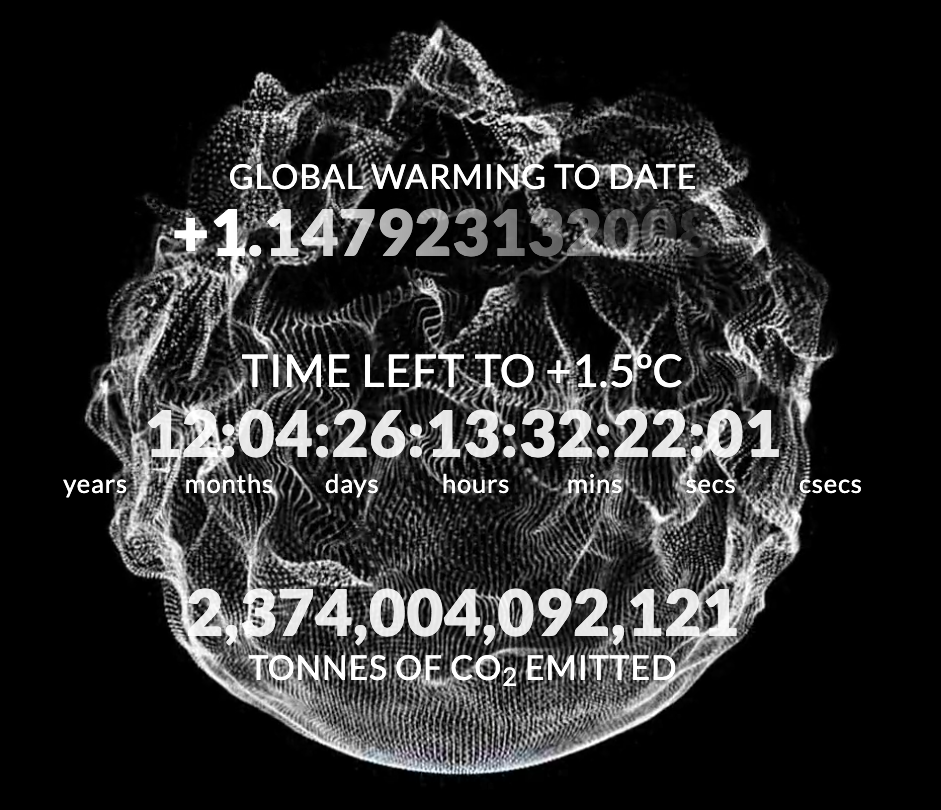
The Numbers on the Clock
The Climate Clock answers the question: given the current rate of emissions and level of human-induced warming, and assuming the emissions trend over the past five years continues into the future, how long will it be before the remaining allowable emissions for 1.5°C are used up?
1. Tonnes of CO2 Emitted
This value shows the total accumulated CO2 emissions from fossil fuel burning, cement manufacture and deforestation since 1870, based on the most recent data from the Global Carbon Project.
2. banner: /img/ to Date
This number represents the human contribution to observed global temperature increase. This Index represents the portion of observed temperature change that can be attributed to all human drivers of climate change. We use 1850-1900 as the reference temperature for the “pre-industrial” period.
This is the earliest period for which we have reliable measurements of global temperature, and is the most common reference period for pre-industrial temperatures used in scientific analyses and policy discussions.
3. Time left to 1.5 and 2°C
The time remaining until +1.5 and +2 °C date is estimated by extrapolating the most recent 5-year trend of global annual fossil fuel CO2 emissions and calculating the time until we emit the remaining carbon budget—the total allowable emissions for 1.5 and 2°C.
Greta Thunberg, Warrior for the Future
You have stolen my dreams and my childhood.
Greta Thunberg
School Strike for Climate
"All we have to do is wake up and change."
Greta Thunberg